“Medicare-for-All” Understood as Lower Premiums for Me?

By |2019-05-07T20:39:01+00:00May 7th, 2019|Health care spending, Health Care Trends, Health Plans, Health Reform, Insurance, Medicare, Medicare For All, Out-of-pocket spending, Uncategorized|

“Medicare-for-All” Understood as Lower Premiums for Me?

Proposals for Medicare-for-All, or more accurately, universal health coverage, are being introduced by both Congress and state legislatures at a rapid pace (see this useful interactive tool, The Many Varieties of Universal Coverage from The Commonwealth Fund). While policy types argue over how such a plan would be funded and how to set reimbursement rates for providers, and Wall Street frets about what single payer health coverage would do to health insurance companies, state legislators and regular people seem to have a different perspective. In my many conversations with people across the country about the idea of “Medicare-for-All,” I have found it striking how often people say they favor such an approach because they want lower health insurance premiums.

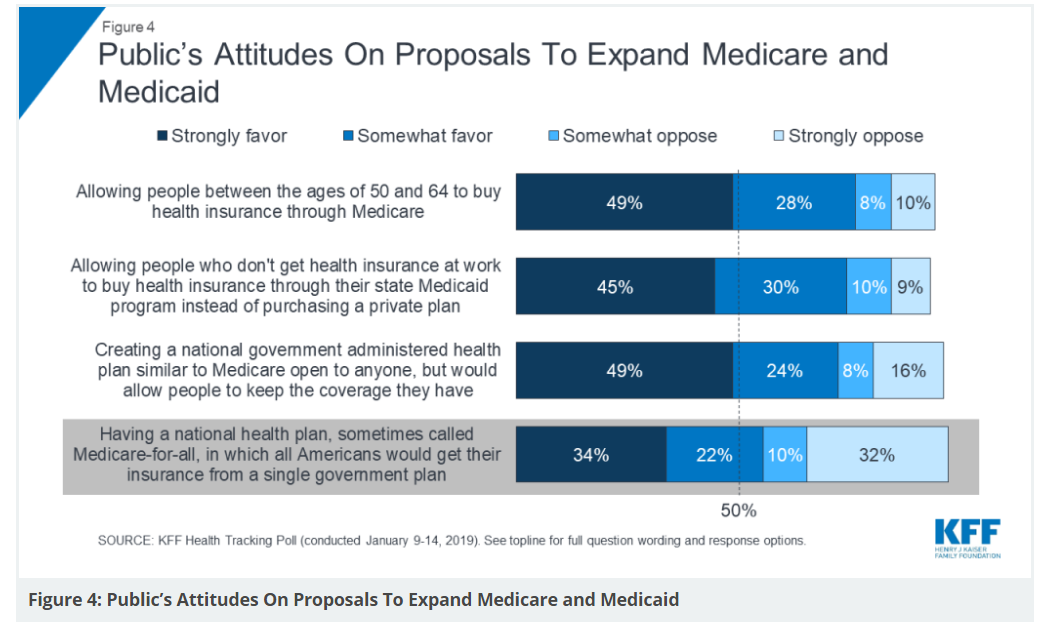
I think we may have a language problem. When health policy people hear “Medicare-for-All”, they think “change the health care delivery and insurance infrastructure from employer contributions to taxpayer contributions,” but maybe when regular people say “Medicare-for-All”, they mean “please find a way to lower my premiums”. The Kaiser Family Foundation Health Tracking Poll conducted in early January hints at the importance of lower premiums as a reason to support “Medicare-for-All” type proposals. As shown in the figure below, nearly 50% of people polled strongly favored proposals that allow people between 50 and 64 years of age to buy in to Medicare, or allow people to buy in to Medicaid, or create a plan like Medicare that is available to anyone. Getting insurance from a single government plan is strongly favored by only 34% of respondents.

These “buy-in” proposals may be gaining in popularity as people lose access to employer-sponsored insurance. Here is the math: “if the coverage rate for employer-sponsored insurance was the same in 2017 as it was in 1999 (67.3%), almost 24 million (or 23.8 million) additional people would be covered through an employer plan in 2017.”

It’s easy to understand why people would focus on lower health care premiums; rising premiums are having a big impact on household incomes. As fewer people are receiving health insurance through their employer, they are also being exposed to higher costs for health care premiums. We pulled recent information on employer and worker contributions for health insurance, the average national premium for a person earning just over 400% of FPL ($49,000) to buy a health plan on the ACA Exchange at various ages, and Medicare premiums. We then created a rough comparison chart of what premiums an individual might have to pay for health insurance based on how they accessed coverage. Below is what we found:

Notably, the average annual premium for employer-sponsored coverage of an individual was about $6,900 last year. But employees usually paid just 18% of that amount. For people who may have been covered by their employer for years, and then have to buy insurance in the ACA Exchange, the loss of that employer-sponsored contribution to their health insurance coverage could be quite a shock.

It’s a catchy phrase and easy to hashtag in social media, but is the appeal of Medicare-for-All driven largely by the hope that a person’s premiums will be lower? Is Medicare-for-All the best or only way to achieve lower premiums? As with all policy issues, we should probably start with the key question, “what problem are we trying to solve” and then go from there, always checking to see that we are, in fact, addressing the problem we are trying to solve with a workable solution.

We Pay for What We Value. Guess What We Value in the U.S. Health Care System?

By |2019-02-04T17:27:13+00:00February 1st, 2019|Health care spending, Health Care Trends, Hospitals, Insurance, Providers, Uncategorized, What do we pay for and why|

We Pay for What We Value. Guess What We Value in the U.S. Health Care System?

People often ask what the difference is between the United States and other health care systems. Health Affairs recently published a helpful piece focused on comparing costs entitled “It’s Still The Prices, Stupid: Why The US Spends So Much On Health Care, And A Tribute To Uwe Reinhardt” by Gerard F. Anderson of Johns Hopkins Bloomberg School of Public Health, Peter Hussey, a VP at RAND Corporation in Boston, and Varduhi Petrosyan, a professor and dean in the Turpanjian School of Public Health, American University of Armenia, in Yerevan. The article is an update of a similar one they published back in 2003, along with Uwe E. Reinhardt, who was the James Madison Professor of Political Economy at the Woodrow Wilson School of Public and International Affairs, Princeton University, until his death in November 2017. The authors compare the health care costs, accessibility, spending growth rates, and other fees in OECD countries.

Notably, there is no concise chart in the article, showing the side-by-side of this information – so we made one! We also calculated a multiple, to see how much more (or less, but usually more) the U.S. spends compared to the median of the OECD countries.

In the chart below, we tried to focus on the main categories of health care costs – health insurance administrative costs, hospital care, physician salaries, nurse salaries and pharmaceutical spending. Interestingly, the information needed for a comparison across countries and categories was not always available in the Health Affairs article. This highlights a pretty big problem with health care data – researchers often say that it’s hard to compare inputs across countries because of their different systems and economies, so they just don’t. This means we don’t actually know for sure how these costs compare to each other.

You may notice the huge difference in per capita health insurance administrative costs. The fact that the U.S. spends almost 8 times as much as the median of OECD countries on health insurance administrative costs (and not actual health care) is rarely a focus of health system policy change, though it is well-known:

“The next-highest-spending country after the US (Switzerland) had administrative costs of only $280. In 2017 Steffie Woolhandler and David Himmelstein [Commonwealth Fund] estimated that the US would save about $617 billion (about 20% of its total health spending) if it moved to a single-payer system.”

We have written about standardizing a set of forms before. Maybe this is a good place to start addressing health care costs in the U.S.?

Another area of high cost in the U.S. compared to other countries is hospital and health care providers. According to the Health Affairs article, all of the inputs for hospital care – including “health care workers’ salaries, medical equipment, and pharmaceutical and other supplies – are much more expensive than in other countries.”

Why are health care provider costs higher in the U.S.? In part because the allocation of physicians in the U.S. is different from other OECD countries, and skews to more expensive care: the U.S. has the lowest percentage of general physicians relative to specialists of OECD countries.

Making changes seems as easy as the U.S. looking to a country that seems to have lower health care costs and “copying” what they do. But these researchers did this same analysis in 2003 based on 2000 data and now, nearly 20 years later, they found the relative rankings of the countries to be about the same for most indicators. Health care costs are different across countries because health care systems are different across countries. And of course, systems are different across countries because values are different.

Based on what the U.S. spends in different health care categories compared to other countries, we seem to really value health insurance administrative costs. Now we know.

Light Health Care Users: Most Americans Use Few Health Care Resources and Have Low Out-of-Pocket Spending

By |2017-10-09T01:49:05+00:00May 23rd, 2017|Health care spending, Health Care Trends, Insurance, Out-of-pocket spending, Uncategorized, What do we pay for and why|

Light Health Care Users: Most Americans Use Few Health Care Resources and Have Low Out-of-Pocket Spending

Every day we read news coverage focused on rapidly rising health care costs, but a seldom-reported part of the story is how very few people are responsible for those costs.

A study of health care costs from 1977 to 2014 shows that over the length of the study period, the top 1 percent of the health care using population consistently cost the system more than the bottom 75 percent. Just 1 percent of the population, in fact, accounts for nearly a third of medical spending.

The study, published in the April 2017 issue of Health Affairs, finds that “most Americans use few health care resources and have low out-of-pocket spending.”

In addition, more than 93 percent of these light spenders (those in the bottom half of the population) believe they have received “all needed care in a timely manner,” and the light spending by the majority of the population “has remained almost unchanged during the thirty-seven-year period.”

This light spending has also remained “unchanged since the inception of the Affordable Care Act (ACA),” as a Medscape article on the study notes.

These findings matter because most health care policy discussions focus on spending at the population level – in other words, on the 1 to 5% of the U.S. population that incurs significant medical costs. That isn’t how individuals think of health spending, however. Most of us think of what we as individuals, or perhaps our family, spends on health care.

Insurance, by design, must include many non-users, so to speak, in order to work. Most of us buy home insurance or car insurance and never use it. That is, we make payments to an insurer in the form of premiums, but we typically don’t have car accidents and don’t have house break-ins or fires. Similarly, most people don’t have much in the way of medical spending.

But if too many light spenders don’t buy insurance, the price of insurance increases for everyone. And in fact, that is what happens.

This chart from the April 2017 Health Affairs article  shows that the highest spenders are the most likely to be on public insurance – think Medicaid for the severely disabled – and light spenders are the most likely to be uninsured – they don’t think they need it, and they probably don’t for years and years – until something catastrophic happens.

In terms of out-of-pocket spending, for light spenders in 2014 this figure was just $75 on average, which is less than the $94 (in adjusted 2014 dollars) spent in 1977, the authors find. On the other hand, high spenders averaged $1,096 in out-of-pocket costs. And 50% of light spenders had no spending at all (not including health insurance premiums, if they were insured), whereas only 6.1% of high spenders had none.

As we continue to think about how to improve or change health care insurance, delivery, and payment in the U.S., it is important to remember how few people actually interact with the health care system every year. Even for people buying health insurance, a large proportion of people spend little on actual health care services, and that has remained stable for decades.

This makes some complaints about the Affordable Care Act a little easier to understand. As the study explains, light spenders “as a group are unlikely to receive substantial short term benefits from the Affordable Care Act.”

The question is, what is insurance for? We probably shouldn’t design the entire U.S. health care system for people who don’t need care. But the subtle lines of who pays more, the sick or the well, the old or the young, are something we still need to work out.

Go to Top